Unsere Lösungen

Wir haben für alles eine Lösung – und was noch wichtiger ist: Alle Lösungen arbeiten durch unseren Ökosystem-Ansatz optimal zusammen. In unseren derzeit sieben Kompetenzbereichen stehen wir Ihnen mit unserem umfassenden Know-how mit Rat und Tat zur Seite.

Alle Lösungen

Software

Software

Mit unserem Werum PAS-X MES – am Standort oder in der Cloud installiert – und unseren Softwarelösungen für Datenanalyse, Track & Trace, vernetzte Fabriken und intelligente Verpackungen sind wir der weltweit führende Anbieter und Partner der Pharma- und Biotechindustrie. Mit unserem ganzheitlichen Verständnis und Einsatz der Digitalisierung bleiben Sie zukunftssicher und verbinden digitale Innovation mit Nachhaltigkeit.

Übersicht Software

Transportsysteme

Transportsysteme

Suchen Sie nach Wegen, die Komplexität Ihrer Produktion zu reduzieren und gleichzeitig flexibel auf Veränderungen in der Pharmaindustrie zu reagieren? Sie wünschen sich perfekt abgestimmte Produktionslinien, die nahtlos mit Ihrer bestehenden Software und Ihren Maschinen zusammenarbeiten? Wir sind Spezialisten für komplette Transportsysteme im Bereich Pharma- und Medizinprodukte. Unsere Lösungen sind maßgebend im Bereich des kontaktlosen und sicheren Transports von z.B. Glasspritzen.

Übersicht Transportsysteme

Inspektionsmaschinen

Inspektion

Als weltweit führender Inspektionsexperte entwickeln wir Lösungen für die Pharma- und Biotechindustrie. Unser Angebot reicht von KI-gestützten Hochleistungsmaschinen und Halbautomaten über Laboreinheiten bis Inspektionsapplikationen für die Inprozesskontrolle. Als Pionier auf diesem Gebiet sorgen wir stets dafür, dass Maschinen und Software die gleiche Sprache sprechen.

Übersicht Inspektion

Maschinen-Finder

Verpackungsmaschinen

Verpackungsmaschinen

Wir sind führender Anbieter von Verpackungsmaschinen für flüssige und feste pharmazeutische- sowie für medizinische Produkte. Mit unseren Blister-, Sachet- und Stickpackmaschinen bieten wir Lösungen für Primärverpackungen. Unsere Side- und Topload-Kartonierer setzen weltweit Standards für die Sekundärverpackung. Unser Ökosystem-Ansatz stellt sicher, dass alle Maschinen, Software und anderen Komponenten harmonisch und auf höchstem Niveau zusammenarbeiten.

Übersicht Verpackungsmaschinen

K.Pak Topload Case Packer

Introducing our latest solution from Körber; the K.Pak Topload Case Packer! Created specifically for the pharmaceutical industry, the K.Pak solution provides operator-friendly machines to complete any production line. Our solution focuses on innovative technology, high-quality design and expert handling and packaging of your product. It’s time to start connecting the dots with Körber!

Verpackungslösungen

Verpackungslösungen

Als langjährige Spezialisten entwickeln wir Verpackungslösungen für innovative und hochwertige Pharma-Sekundärverpackungen aus Karton. Wir bieten Ihnen Lösungen für Fälschungssicherheit, Standard- Faltschachteln und vieles mehr.

Übersicht Verpackungslösungen

Beratung

Beratung

Unsere Experten beraten Sie nach der Analyse Ihrer Anforderungen, zeigen Ihnen Optimierungspotenziale auf und unterstützen Sie bei der Implementierung von Projekten in allen Bereichen der Pharma-, Biotech- und Medizinproduktindustrie. Unser Ziel ist die ganzheitliche Optimierung Ihrer Factory of Excellence.

Übersicht Beratung

Services

Services

Sie benötigen Hilfe bei einem bestimmten Produkt oder haben Fragen zu einem unserer Kompetenzbereiche? Skalieren und entwickeln Sie Ihre Factory of Excellence optimal weiter – mit Körber. Wir bieten Ihnen proaktive, datengestützte Beratung und Services für nachhaltigen Erfolg.

Alle Services

Lukas Marschall

Blog

What to do with bioprocess data in pharmaceutical development and commercial manufacturing?

Expert using bioprocess data analytics in a pharmaceutical development environment.

Highlights

  • Overview, challenges, and solutions for bioprocess data management
  • Solutions for bioprocess data visualization & statistical analysis
  • Use of soft sensors in bioprocess analysis workflows
  • Werum PAS-X Savvy combines data management and analytics in one platform

As a process engineer working in process development or manufacturing science, you are responsible for efficiently developing high-performing bioprocesses, ensure a robust scale-up and make sure that a commercial process remains in state of control. Consistent data management and data analysis play a critical role in the success of your pharmaceutical development and manufacturing goals. The main challenges are:

  • Where is the data and how to get it?
  • How to aggregate the data and make it available to analysis?
  • How to analyse the data?

If you are working in the field of bioprocess development, scale-up process validation, or manufacturing excellence, you might frequently ask yourself: How do I get a complete and reliable overview of the process data with less effort? How to structure the ample amounts of data from different sensors in a single database? How to aggregate data from small and large scale to perform scale-down model qualifications? Which methods shall I use for pharma data analytics and the statistical evaluation of bioprocesses? 

PAS-X Savvy provides a solution to all of these challenges. This article gives a brief overview of bioprocess data management, bioprocess data visualization, and statistics to evaluate bioprocesses. 

Data management

As a process engineer you have to deal with large amounts of sensor data (e.g., pH, temperature, and dissolved oxygen measurements), product quality data (e.g., product concentrations, specific activity, relative potencies), “non-numerical” data such as pictures (e.g., scanned SDS-PAGE data) and many more. For every analysis purpose, you need to manually reorganize the data in a time-consuming process from different data sources. 

The first and often most critical challenge you face is to get the data in one place. The data is usually spread across many locations in a company. Different departments, different devices and data storage systems. Once you get the data, you encounter multiple types of data that require different treatment.

We classify data into two major classes:

1. Time Series Data

  • Data recorded over time (i.e. each value has an associated time stamp)
  • Can be further classified in:
    • Data that is recorded on-line by a system 
      • Often available in a high timely resolution
      • Often exportable in defined export formats
  • Data that is recorded manually 
    • Often in a low timely resolution 
    • Often captured in varying formats

2. Feature Data (F)

  • Single point data (i.e. only a value)
  • Can be further classified in:
    • Scalar features
      • Physical quantity that is completely described by its magnitude
    • Categorical features
      • Assigning a unit operation to a particular group or nominal category.

Challenges with time series are that for one run they often are recorded by different systems and might occur in different timely resolutions. Additionally, when comparing multiple runs with each other, it’s required to align them to specific events in order to make them comparable (e.g. time of inoculation for fermentation processes or start of elution in chromatography).

You can gain the highest amount of information by combining all types of data. That requires that you organize your data. If done manually this is very time consuming and needs to be done again if new data arrives. Not seldomly, data analysis projects consist of 80% data mining and alignment and only 20% of the actual analysis.

One solution might be that you use 2nd level systems that you already have in place. In the case of a fermentation process you might be able to use the available SCADA software for data alignment. Third party systems (e.g. off-gas analyzers and weight balances) can often be connected to the software. Some tools even provide the possibility to add manually recorded data. When exporting the data make sure that you adjust the timely resolution to a level where you still get relevant information while keeping the datasat size at manageable level. It’s recommended to set up SOPs for the export of such systems, so that you can make sure that the variable naming is consistent and the data format stays the same.

Factsheet: How to get the most out of your multi-fermenter data

Learn how PAS-X Savvy helps you to evaluate Ambr® experiments as efficiently as possible, accelerating the whole biopharmaceutical process development. 

Download PDF

Best-practice database requirements are i) a suitable database model to store all bioprocess relevant data in one common database, ii) the possibility to add meta information to time-series data (e.g. define process phases and events), and iii) management of data pre-processing workflows.

With it’s unique data model, PAS-X Savvy aligns and contextualizes all data from MES, ELN, LIMS, DCS, historians, data lakes and single devices and makes them available in one single platform. Customizable database filters help you to quickly identify relevant batches, unitoperations and data types and create your own datasets.

Having all data in one place, the next challenge is to select the right visualization technique dependent on the data type.

Visualize data

Visualization is the most essential tool to detect processing trends and to investigate deviations. To detect trends fast and report the results, ideally the visualizations are directly created from a common database, without the need for exporting the data or manually manipulating data in spreadsheets – which is prone to handling errors and not recommended. Each data type requires different visualization techniques, like multi-axis overlay plots to analyze processing trends, and box plots/histograms to relate quality and product attributes, are excellent for viewing your data.

Commonly used visualization tools for bioprocesses are:

Multi-axis overlay plots

This allows to compare time series (e.g. fermentation data, chromatograms, etc.) of multiple manufacturing runs and developmet runs. In order to make different runs comparable, timeseries need to be aligned to events first (e.g. time of inoculation, timepoint of elution). In a second step, the timeseries can be grouped by categorical features already allowing simple but highly effective visual data analysis. 

Bar graphs

Visualization of values as bars. Each run is displayed as separate bar. Ideally the uncertainty around the measured values can be displayed as error bars. Grouping the bars by a categorical feature enables a simple visual data analysis.

Box plots

A variable is displayed as box. It displays the minimum, the maximum, the sample median and the first and third quartile. This plot helps to identify how the data is distributed. Grouping by categorical features enables simple visual data analysis. The data of the displayed feature is then divided into groups based on the levels in the categorical feature. The groups are displayed as separate boxplots.

Line plot/Trending plot

Numerical features are plotted as line in consecutive order. Applied in e.g. CPV trending for assessment of process robustness and identification of trends.

The visualization app of PAS-X Savvy offers visualization techniques for all bioprocess relevant data types and allows you to easily plot and align your data.

Commonly used statistical tools

Statistical equivalence testing: 
Does my process perform similarily across scales?

Hypothesis testing provides statistical guidelines for decision making. By that the error associated to a decision can be controlled or minimized. The questions asked are usually: is it reasonable to assume that the value of a population parameter is equal to, larger or less than a defined threshold? Such tests can be applied to compare the mean or variances of e.g. two manufacturing sites. These tests usually only assess the statistical significance of a result, but not the practical relevance. E.g. a difference in means of two groups might be statistically significant, but not practically relevant. Equivalence testing provides a simple solution that allows for testing the hypothesis for practical relevance (Limentani et al., 2005). Using e.g. a two-one sided t-test can provide insight whether there is a practically relevant difference between two manufacturing sites.

Principal Component Analysis: 
Is my process running consistently?

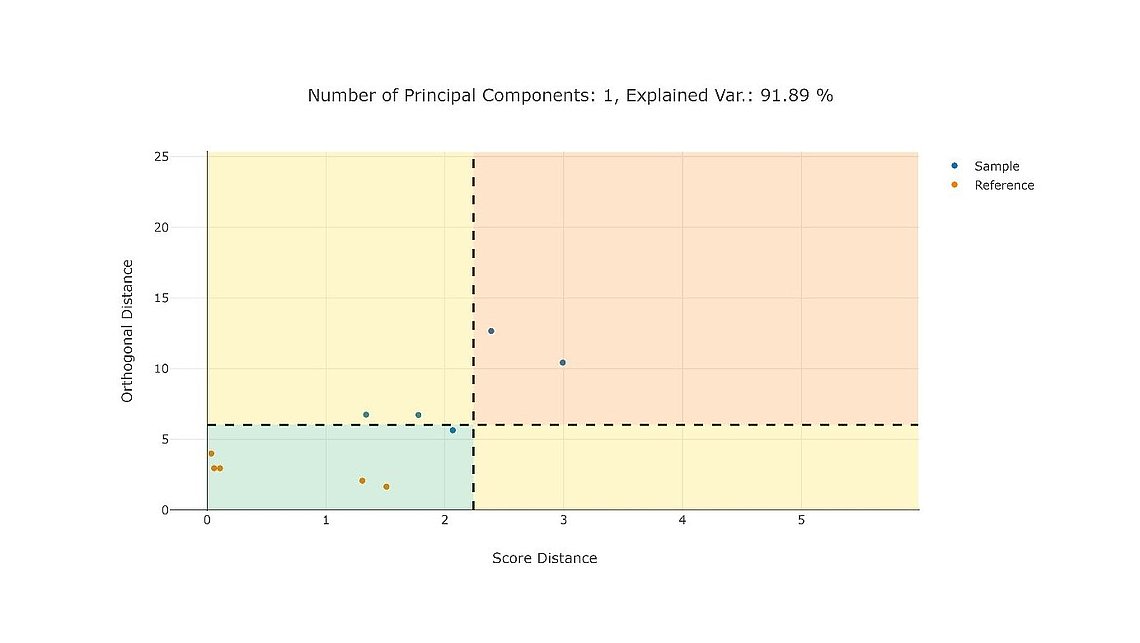
This method for dimension reduction enables the visualization of multi-dimensional data in simple plots. Manufacturing campaigns can be compared based on multiple scalar features (e.g. process parameters and quality attributes). Multiple two-dimensional plots can be created. They differ in the chosen y- and x-axis. If principal components are chosen as axes (biplot), the plot allows to reveal clusters within a group of manufacturing campaigns. Another alternative is to choose the score distance and the orthogonal distance of the individual campaigns to the model as axes. This allows to identify outlying campaigns in a multivariate space.

Multivariate regression techniques: 
How do my process parameters impact product quality?

PAS-X Savvy supports you with user-friendly applications to perform statistical tasks along the product life cycle.

Soft Sensors for information mining

Soft sensors make the most out of your data and signals that you have you are collecting already. So instead of buying more and more hardware, soft sensors help you to get more information on your system solely using the data you already have.

Summary

One of the most critical questions a process engineer or process development manager has to answer is how to realize data management, visualizations, and must-have statistics. One possibility is to use spreadsheets. Although this might sound like a quick fix, you will run into severe difficulties in the short and long run. First, you will miss the possibility of smart ways to search for batches and filter for the data you really need. The calculations are time-consuming and rarely reproducible by another scientist or for management review. You will spend much time trying to standardize your Excel sheets using formulas and macros, and in the end, they are likely inconsistent. In the long run, you will lose a lot of time copying and pasting data from spreadsheet to spreadsheet.

A second possibility is to manage your data in a central database and connect it with statistical and visualization software. Various data sources with different data models and data formats have to be handled by the database. The data model will be very complex, as in addition to timeseries data and numerical features, you must store additional information such as run names, process phases, etc. In addition, all tools need to be maintained, and you will quickly find yourself in a costly patchwork of many different software components without the possibility of direct database integration.

The ideal solution is to use a centralized solution like PAS-X Savvy that combines data management, visualization, data analysis and reporting in one place. PAS-X Savvy is used to automate your data management, visualization, and statistical analysis for the bioprocess lifecycle for upstream, downstream, and quality data. The world’s top pharma and biotech companies trust in PAS-X Savvy – as a partner for process engineers – in R&D, scale-up, tech transfer, validation and manufacturing in more than 200 installations.

PAS-X Savvy – accelerate your data journey

Brochure: How PAS-X Savvy revolutionizes managing, analyzing and reporting of your pharma and biotech process data

Download PDF

Get in touch with us for more information or a free demo!

Get in touch!
 

Kommentare

Keine Kommentare

Kommentar schreiben

* Diese Felder sind erforderlich

nach oben
nach oben