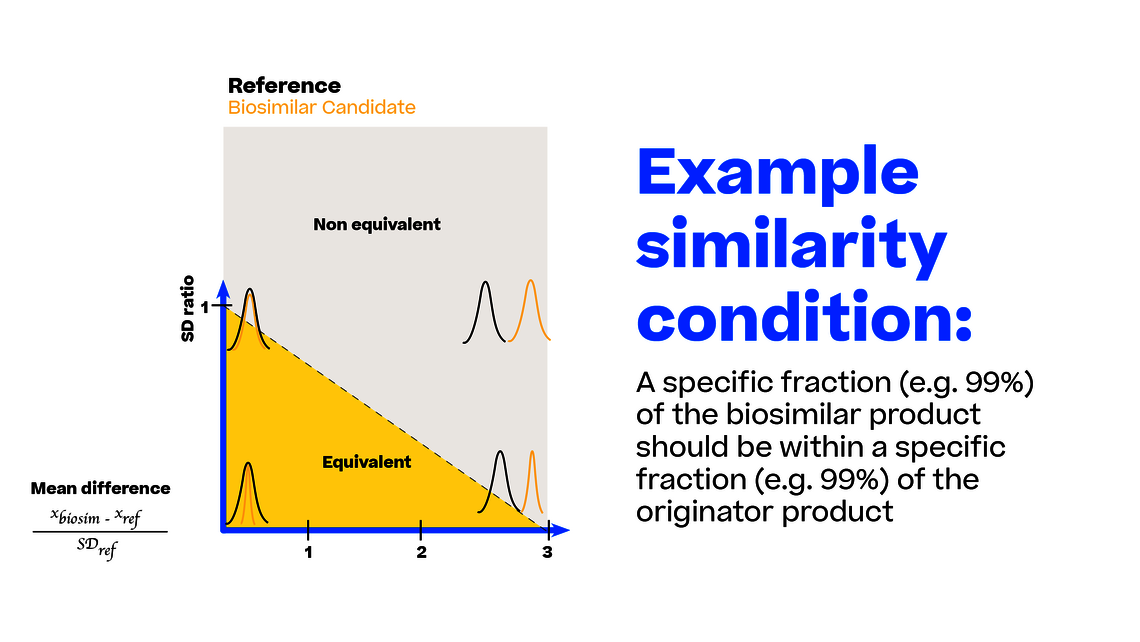
For comparing the “imperfectness” of different tests to this ideal state, we can generate sample data with a given sample size (e.g., 20 lots for each biosimilar and reference) from any point of this coordinate system. Remember each point in this coordinate system translates into an exact definition of the biosimilar and reference population (mean and SD).
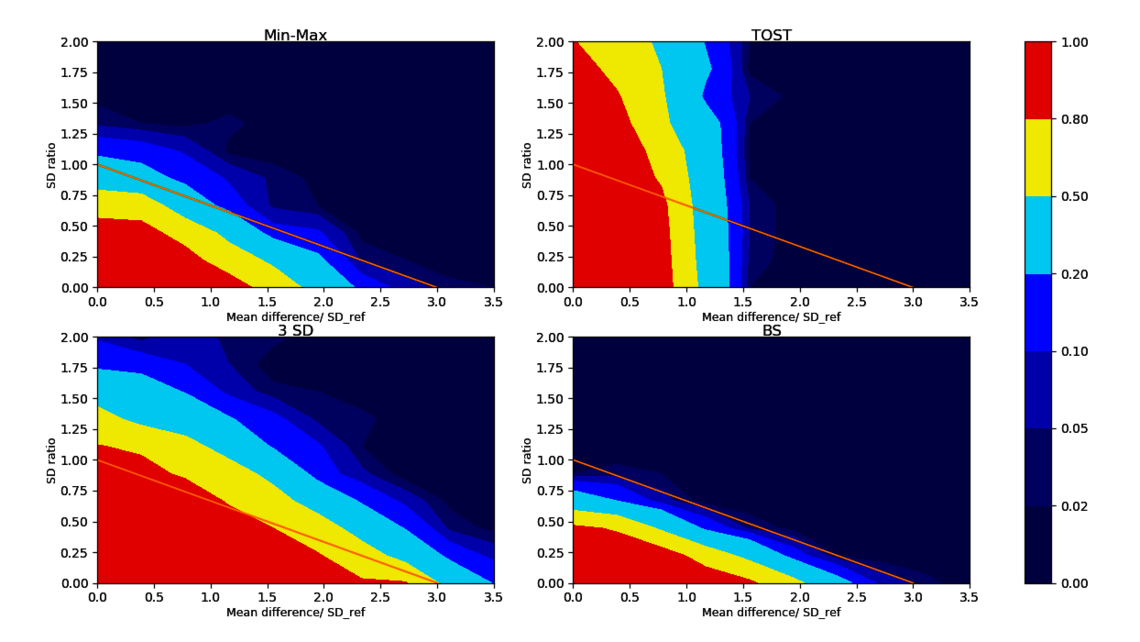
For each test listed above we can count how often the test accurately accepts/rejects biosimilarity. For typical sample sizes (such as 20 lots of each biosimilar and reference product lot) we see the acceptance rate for biosimilarity plotted over different scenarios for different tests in Figure 3.
Let’s compare the bootstrapping test to the frequently applied 3 SD test: As we see in the lower left corner of Figure 3, the 3 SD test accepts for biosimilarity in large areas of the non-equivalence regions as indicated by the large red and yellow fraction outside the similarity condition. This leads to a high regulatory risk of falsely accepting biosimilar candidates that are truly not biosimilar. Moreover, this test is flawed as it becomes easier to pass as the sample size of biosimilar data decreases³ ⁴ ⁷. The same situation is true for the min-max test (top left of Figure 3).
As shown in the upper right corner of Figure 3, the TOST equivalence test only checks for the difference in means (x-axis) but also incorrectly accepts for biosimilarity (red areas) when the SD of the biosimilar population is way larger than the SD of the reference (large y-values in our coordinate system).